Performance analysis of censhare Server
How to perform a censhare Server basic performance analysis (ca. 15-60 min.) for all logged-in users up to the case that no new client login is possible.
Important hints
In case of performance problems, always perform these checks as a first step.
Execute these checks on the application server where the performance issue appears.
A censhare Server performance problem could also lead to a censhare Client login problem.
Always save and attach analysis data (marked as #analysis data within the text) before a server restart. Otherwise, further analysis of the root cause is not possible.
Basic checks
Perform the following basic checks before you move on with a deeper analysis.
0 // Check for OutOfMemory
Login via SSH.
Execute the following unix command(s) to see if the server got an OOM error.
ls -ltr /opt/corpus/*.hprof grep OutOfMemory ~/work/logs/server-0.*.logIf a heap dump file with the current timestamp exists and its file size no longer increases, the jvm process has an OOM error and the creation (-XX:+HeapDumpOnOutOfMemoryError) of the heap dump file is done. You need to restart the censhare Application Server (not hardware) to solve the incident. For further analysis, check if the server has enough JVM -Xms / -Xmx allocated. If yes, server-0.*.logs and heap dump (*hprof) file need to be transferred to request a heap dump analysis.
1 // Check the system load
Login via SSH.
Execute the Unix top command and watch it for a few seconds. Execute the ./
For more information, see jvmtop.sh or top -H command and watch it a few seconds.- Take a few screenshots of the top command (#analysis data).
- Take a few screenshots of the jvmtop/top -H command (#analysis data)
top: Check if censhare Server (java) process has a high load (permanent 100%).
jvmtop: Check if there are censhare Server threads which have a high load.
 See below and there may be systems where 100% load means all cores and some systems where 100% means one core. In the later case, 250% for a 4 core system would be still OK.
Check if the whole system has a high load (values like 1-2 are normal, depending on CPUs).
A load of one means that one core is used for 100%, a bigger value means that processes are waiting for execution if only one core is available. So a load of 3 for a 4 core system would be still OK
Clue: If there are multiple java processes, use the Unix jps command to identify the PID of the censhare Server java process.
2 // Check the censhare garbage collection log files
Download log files with Unix command cssgetlogs (2459174). cssgetlogs is a censhare internal Unix script. Partners/customers can use SCP to download the log files (#analysis data).
The following grep examples apply when using "throughput GC" (Parallel GC/Parallel Old GC), which performs a Stop-the-World when the memory is full. It does not apply when using a concurrent collector such as Garbage First (G1). Graphical visualization & insightful metrics of G1 GC logs can be analyzed with a GC log analysis tool, for example http://gceasy.io/.
Login via SSH
Execute the Unix lgl command (go to the end of the log file) and watch it for a few seconds.
Check for high "Full GC" times and/or frequent intervals (good would be a Full GC every hour with a duration of max. 10 seconds, but it depends on the system.
A Full GC means a stop of the censhare process. Therefore these stops should be short and rare. Stops of less than 3 seconds and only every 3 minutes or even longer are perfect.
Check that the garbage collection actually does its job: ParOldGen: 292282K->290141K(3571712K) means: 3571712K available, 292282K used garbage collection clean that down to 290141K.
If the GC cannot free considerable amounts of memory then there's an issue.
If existing, potentially there is a memory problem. We need a heap dump for further analysis (ask the customer for approval if there's no auto-created heap dump and you have to create a manual one as it costs performance to create one! And ensure that there's enough disk space available!
A possible cause could be that the remaining jvm size is too small (jvm size - cdb cache size = remaining jvm size) or a memory leak.
A discussion of system memory, heap size, and CDB cache settings should always consider the number of assets (current version) in the customer database:select count(*) from asset where currversion=0;CODE
Clue: Check for high full garbage collection times and/or frequent intervals.
grep "Full GC" ~/work/logs/gc.log
gclog="$(ls -1tr ~/work/logs/gc.log*|tail -1)"; echo $gclog # if there's no gc.log but a gc.log.0
grep "Full GC" $gclog3 // Check the censhare Server log files
Download log files with the Unix command cssgetlogs (2459174). cssgetlogs is a censhare internal Unix script. Partners/customers can use SCP to download the log files (#analysis data).
Log in via SSH.
Execute the Unix lcl command. Go to the end of the log file) and watch it for a few seconds.
Check if there's a command running frequently (every few seconds) or the log file stalls.
Set $logs variable to censhare server logs to check (for exmple: directly on the server or locally if log files already downloaded)
#logs=/Users/user/Desktop/logfiles-servername/server-0.?.log logs=~/work/logs/server-0.?.logCODECheck for frequent intervals or long taking (more than 3s) loading of XSLT resource assets (special case only in remote environments, see 2555306).
grep -c "resource asset.*loaded in [0-9][0-9][0-9][0-9]" $logsCODECheck for frequent intervals or long taking (more than 60s) AAXsltExecution transformations.
grep -c "AAXsltExecution.*done in [0-9][0-9][0-9][0-9][0-9]" $logs grep "AAXsltExecution.*done in [0-9][0-9][0-9][0-9][0-9]" $logsCODECheck for frequent intervals or long taking (more than 10s) asset queries, cdb updates, cdb checkpoints (possible bottleneck in direction of CDB cache, Storage)
grep -c "asset.query completed all" $logs grep -c "updates in" $logs grep -c "checkpoint finished in" $logs grep "asset.query completed all in [0-9][0-9][0-9][0-9][0-9]" $logs grep "updates in [0-9][0-9][0-9][0-9][0-9]" $logs grep "checkpoint finished in [0-9][0-9][0-9][0-9][0-9]" $logsCODECheck for frequent intervals or long taking (more than 60s) asset executes which are checkout, checkins (possible bottleneck in direction of network).
grep -c "asset.execute completed all" $logs grep "asset.execute completed all in [0-9][0-9][0-9][0-9][0-9]" $logsCODECheck for frequent intervals or long-running SQL statements, resp. trivial ones, for example SELECT NEXTVAL FROM DUAL; which are not forged by a Full GC (possible bottleneck in direction of Oracle DB).
grep -c "SQL statement long execution time" $logs
grep "SQL statement long execution time (ms): [0-9][0-9][0-9][0-9][0-9]" $logs
CODE
4 // Check for RUNNABLE, BLOCKED and RangeIndexHelper.java within jstack outputs
Login via SSH.
Execute the Unix jps command to get the current PID of the censhare Server java process.
Execute the Unix jstack >jstack1.txt command a few times (adapt the output file name).
Download the jstack outputs to your desktop (#analysis data).
Open them via TextWrangler and search for BLOCKED, RUNNABLE and (only if using server version lower than 5.x) "RangeIndexHelper.java"
Clue: BLOCKED should not be found at all. RUNNABLE: check for several identical ones in different jstacks or non-default entries (needs some experience). Special case (only an issue until server version < 5.x ): "RangeIndexHelper.java": should not be found at all, if found see here:

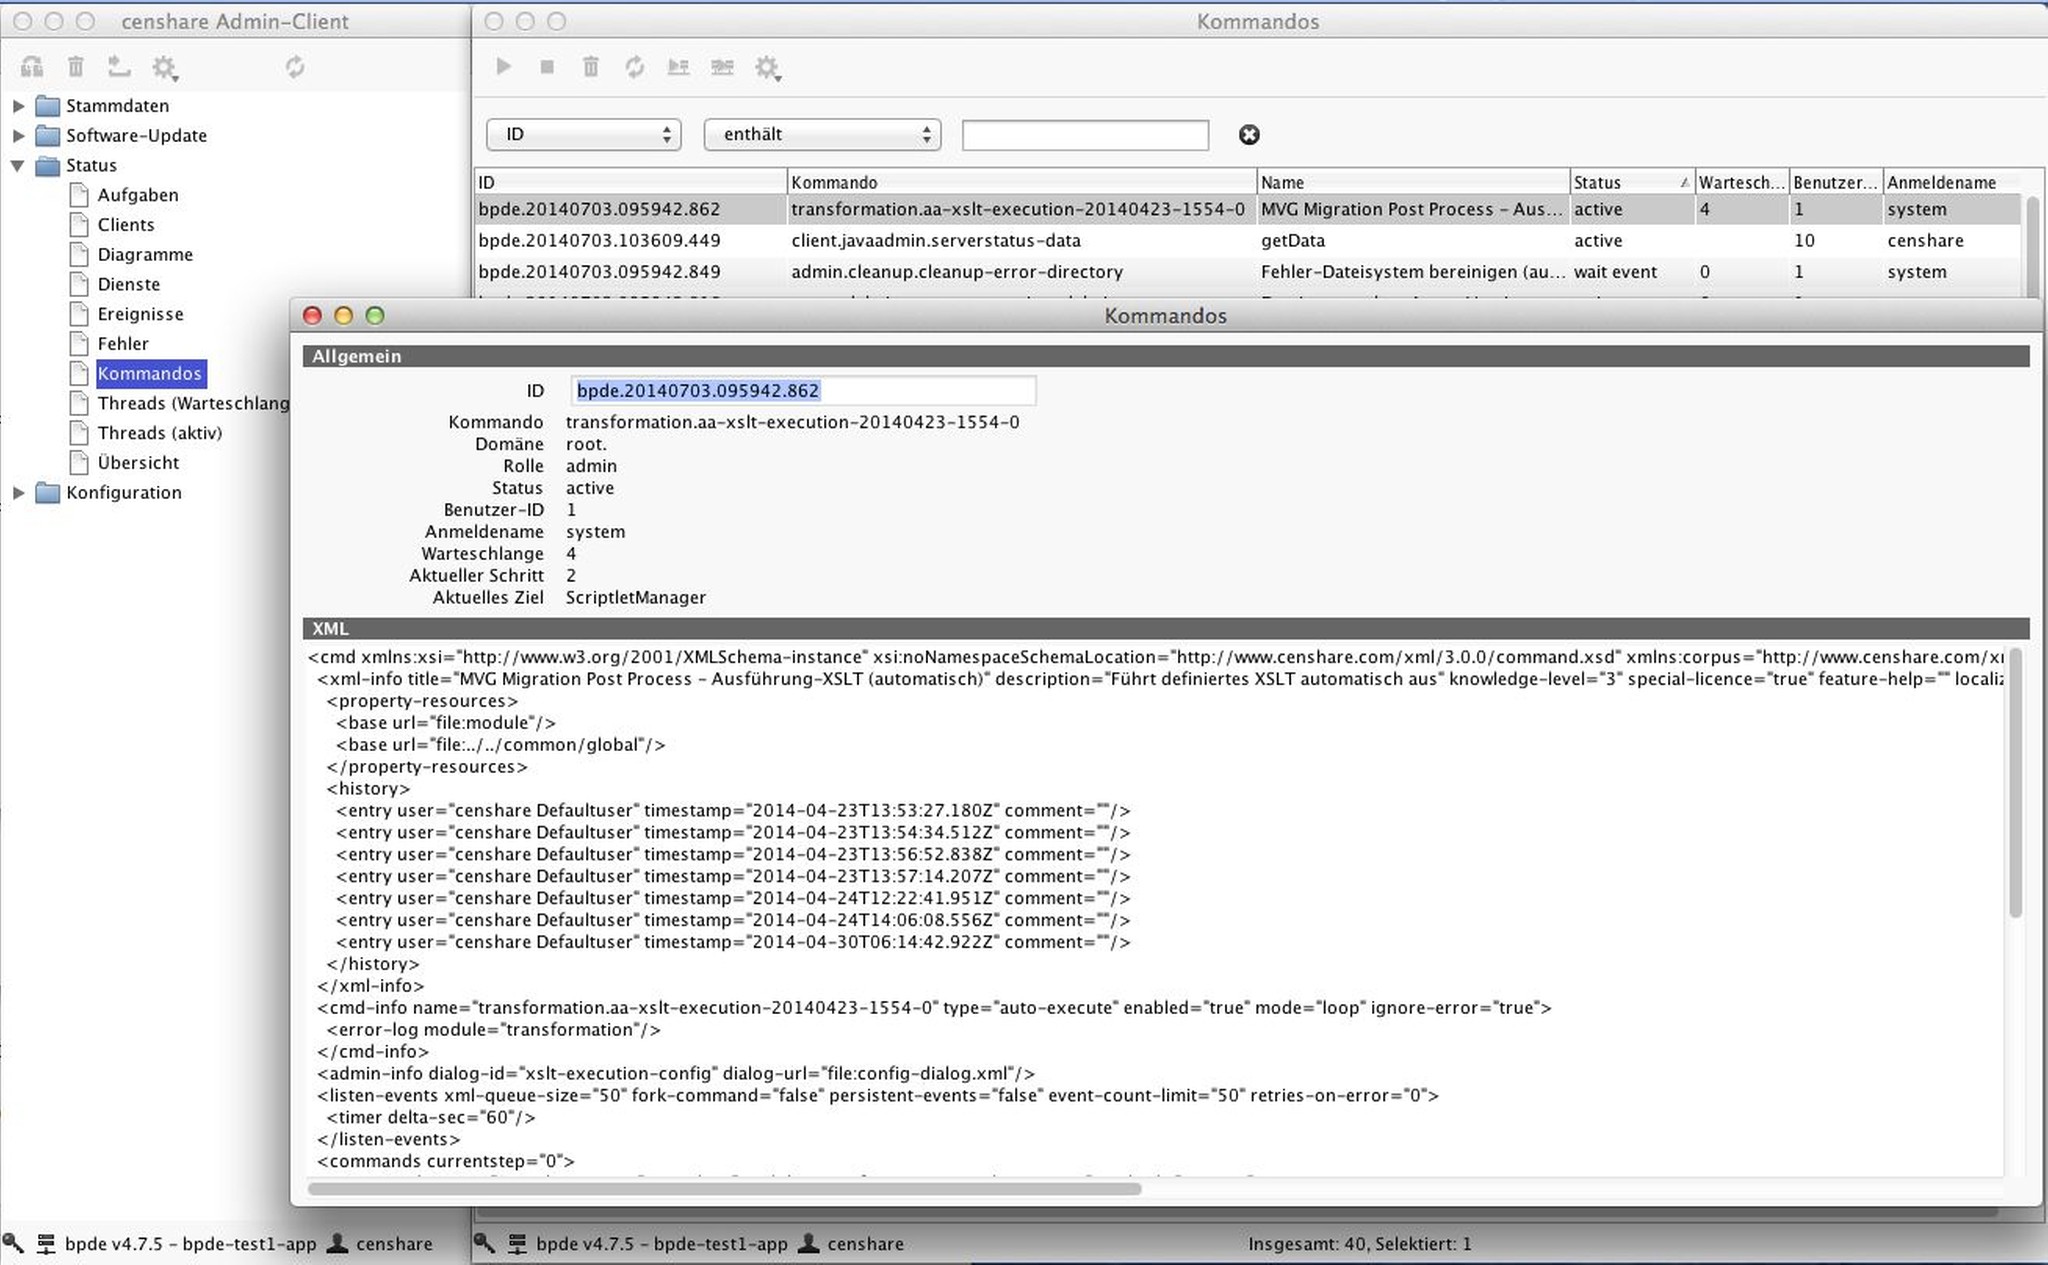
5 // Check active censhare Server commands
Log into the censhare Admin Client.
Go to Status | Commands, open it, sort by column State and take a screenshot of it (#analysis data).
Go to Status | Commands, open it, sort by column Queue and take a screenshot of it (#analysis data).
Check if there is only one command, double click it to get the description name of the module
Clue: More active commands and commands in the queue could be an indicator for a performance issue.
6 // Check censhare diagrams
Log into the censhare Admin Client.
Go to Status | Diagrams, open it and take a screenshot of it (#analysis data).
Check if there are peaks (needs some experience).
Clue: Peaks can be of two types. The line goes up above normal and comes down after some time. This shows there was a problem, but the censhare Server has recovered. If the line goes up above normal and continues to be there, it shows that the problem still exists and may require a server restart.
7 // Add (#analysis data) to the ticket
8 // Check if reported slowness is reproducible on the system
If the reported info is insufficient, ask for an asset ID and exactly the steps to confirm the slowness. Maybe it is only sporadically reproducible.