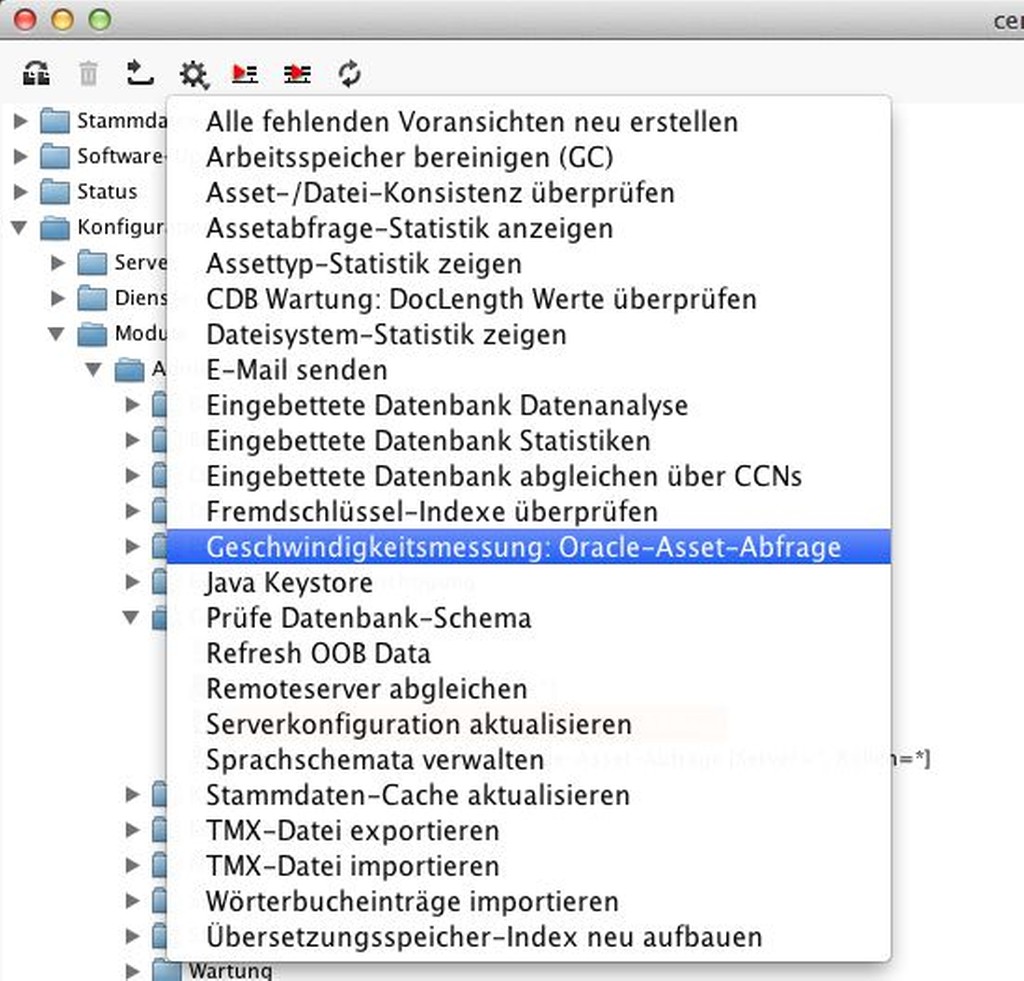
The Censhare Admin Client offers a built-in performance analysis tools for the connected Oracle database.
Context
The check is located in censhare-Server/app/modules/admin/performance/.
Introduction
The check runs automatically after activation (type="auto-execute"). The module is used to monitor the execution of the server process and responds to disruptions.
It is event-based and implemented as an event listener:
<listen-events>
 <event target="server" method="shutdown"/>
</listen-events>
In the Censhare Admin Client, you can access the check in the server actions menu:

Performance measurement: Oracle asset query
For the operation of a production system, it is important to always ensure an adequate performance to measure the database performance on which a Censhare installation depends. Censhare offers a load test for Oracle databases. It measures the normal performance of the Oracle database (baselining) and shows if and when the current performance is deviating from normal.
This module is available via the Server actions menu of the Censhare Admin Client. It can also be configured for other clients.
However, it is expressly aims at database administrators and support specialists.
We recommended to have executed the module several times so that the result is not distorted. Keep in mind that due to caching discrepancies can occur. Since the tests are carried out with 20,000 assets directly to the Oracle database, it is up to you to run the tests at high load, or at least switch to periods of less significant usage figures. This performance measurement determines the assets per second and the average number of sub-entries per asset. If you work primarily with smaller asset files such as text, then of course, you will receive better results than in the case of a video-MAM system.
Example:
Will query 20000 assets from Oracle
Count: 1000, query throughput [assets/s]: 8
Count: 2000, query throughput [assets/s]: 53
Count: 3000, query throughput [assets/s]: 65
Count: 4000, query throughput [assets/s]: 93
Count: 5000, query throughput [assets/s]: 101
Count: 6000, query throughput [assets/s]: 118
Count: 7000, query throughput [assets/s]: 130
Count: 8000, query throughput [assets/s]: 141
Count: 9000, query throughput [assets/s]: 132
Count: 10000, query throughput [assets/s]: 123
Count: 11000, query throughput [assets/s]: 192
Count: 12000, query throughput [assets/s]: 150
Count: 13000, query throughput [assets/s]: 174
Count: 14000, query throughput [assets/s]: 178
Count: 15000, query throughput [assets/s]: 158
Count: 16000, query throughput [assets/s]: 182
Count: 17000, query throughput [assets/s]: 187
Count: 18000, query throughput [assets/s]: 195
Count: 19000, query throughput [assets/s]: 233
Count: 20000, query throughput [assets/s]: 210
Total average query throughput for 20000 assets [assets/s]: 74