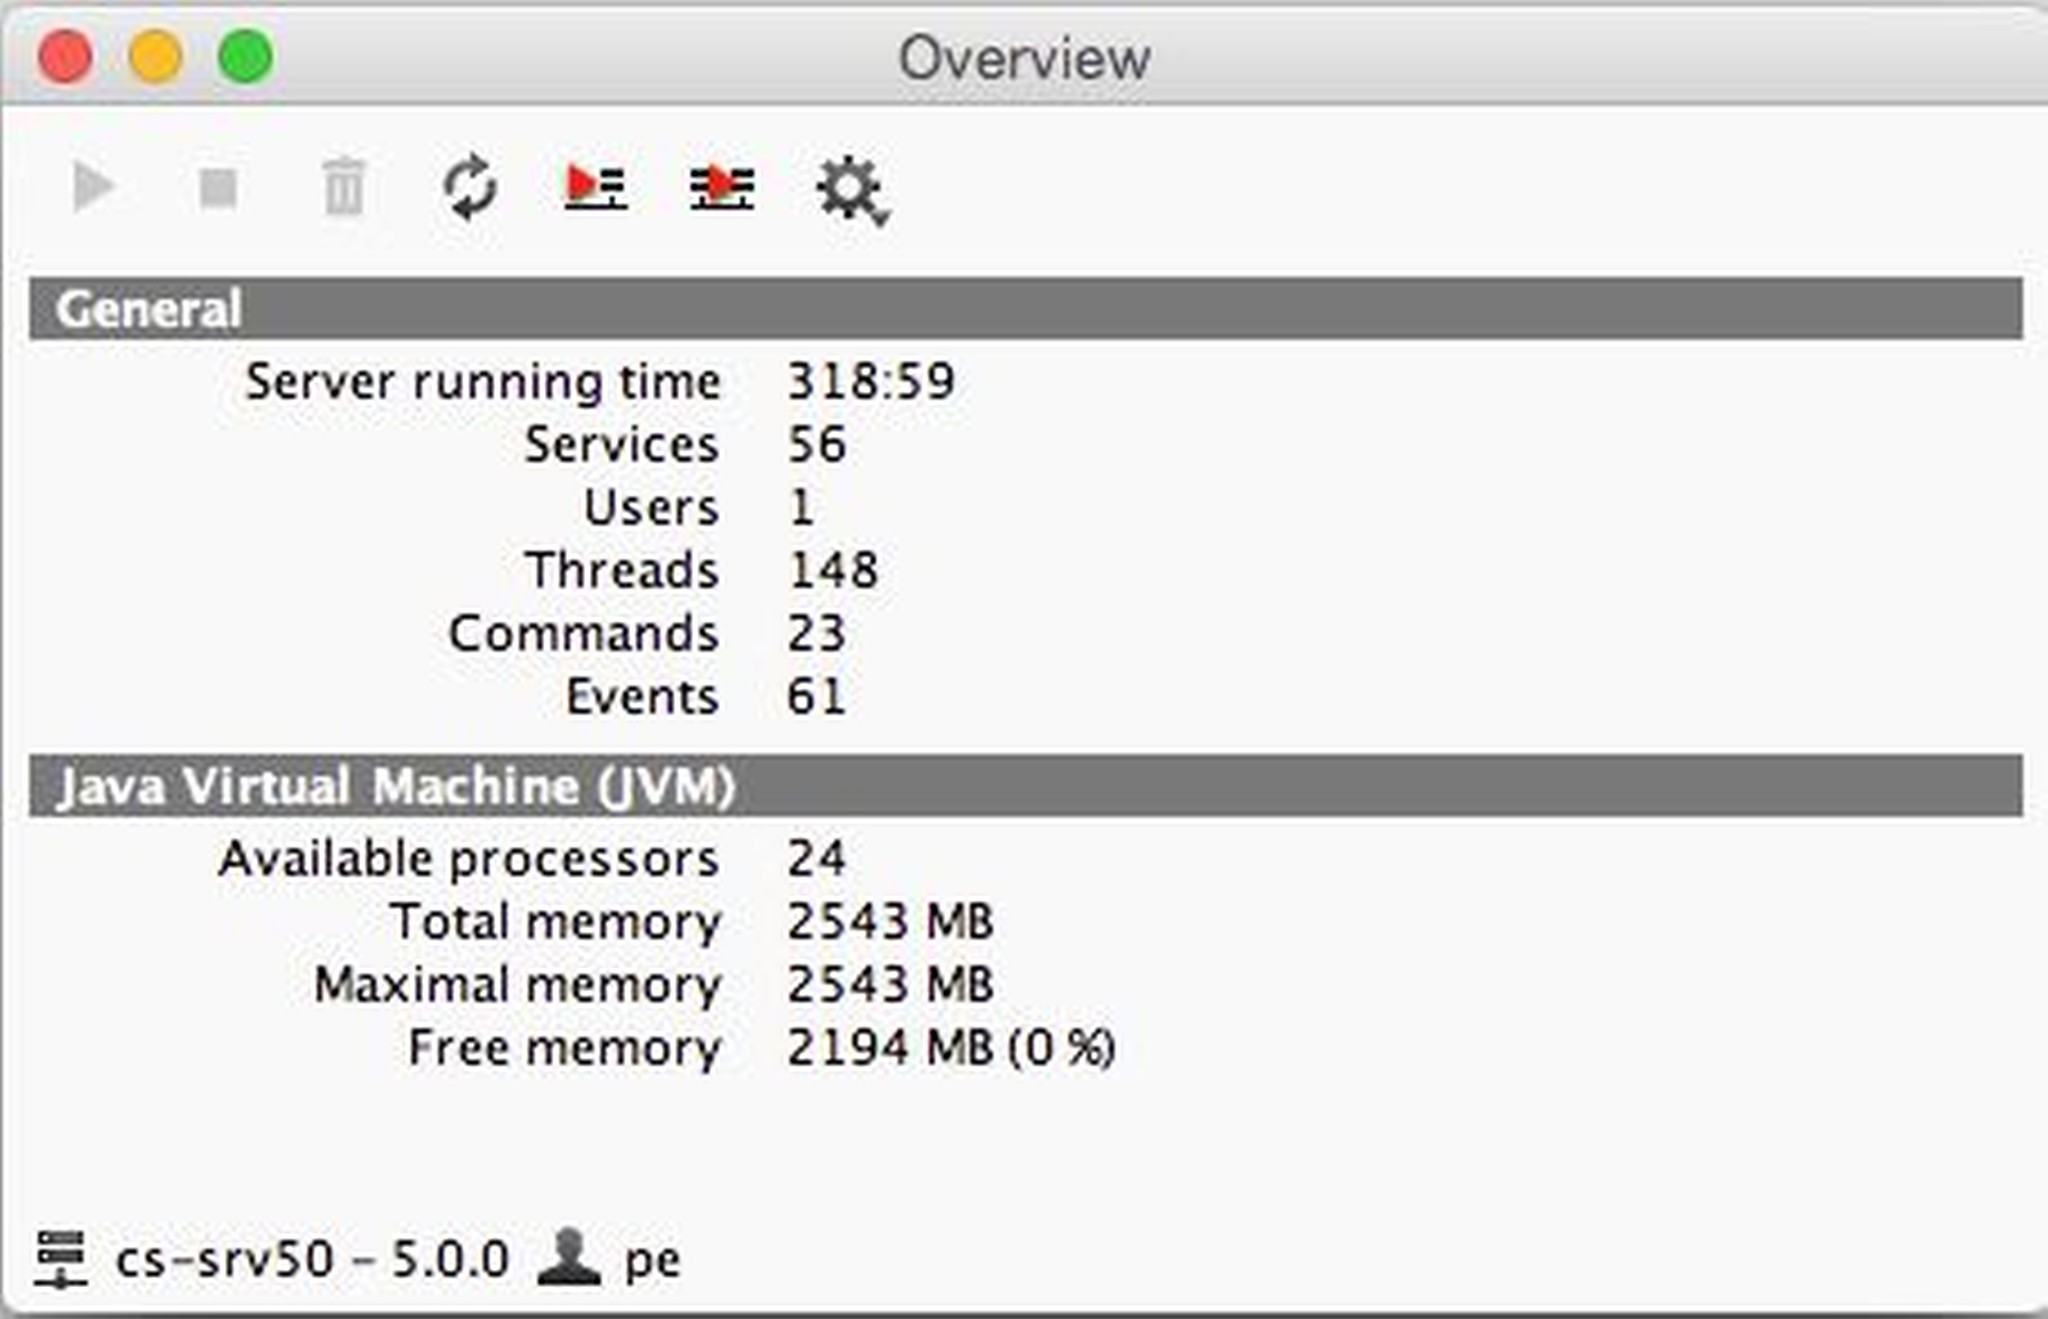
RAM allocation for censhare Server
Monitor the RAM usage of the allocated memory.
Configuration practices

Considerations when increasing the allocated RAM for the censhare Server
On a basic productive censhare architecture, the java applications censhare Server, Web Client, and possibly a local shell Service Client are running on the same hardware. The (Oracle) database service runs on separate hardware. The available RAM (swap to disk not included) represents the physical memory limit.
The maximum memory allocated to the JVM size should not exceed the combined memory calculated from all current (Java) processes[1], plus a 15-20% buffer for the operating system level. Other non-censhare processes also need to be factored in. In a failover scenario, the takeover of (Oracle) database services should also be taken into account. Failure of doing so may result in an undesirable performance problem when the failover happens.
[1] jps -v | grep -v Jps | awk -F "-Xmx" '{print $ 2}' | awk '{print $ 1}'Detailed considerations
Changing the JVM heap memory size requires a restart of the Java application.
The minimum (-Xms10g) and maximum (-Xmx10g) values of the JVM heap memory should always be the same. Different values cost JVM performance.
Java parameters -Xms and -Xmx need a unit (e.g. m or g) at the end. If units are not available, the Java application does not start!
The larger the JVM heap memory, the longer it takes to perform Full Garbage Collections (the time in which the Java application is stopped to clean up memory). Depending on how long a Full Garbage Collection takes, this can have a big impact on all connected users.
The larger the JVM heap memory, the greater the size of the heap dump files in ~/css folder (keyword: disk space usage).
The censhare Embedded Database (CDB) Cache is also located within the JVM. The configured JVM heap memory should not be less than the CDB cache size (data cache size + node cache size) + the buffer for other operations within the JVM.

When to increase the heap size
If you have frequently appearing Full Garbage Collection (GC) intervals such as the following bad example within ~/work/logs/gc.logNote:
We recommend a 'Full GC' every hour with a duration of max. 10 seconds, but it depends on the system. In the example, there is a 'Full GC' every 4 to 5 seconds, with a duration of 3 to 4 seconds. This means that the system is temporarily freezing. If users are working at this time on the system, they notice the freeze. As long as this does not happen all the time until an OutOfMemory error is thrown (possibly a Memory Leak) this is default JVM behavior.
2012-12-24T11:34:25.213+0000: 2744116.330: [Full GC (System) [PSYoungGen: 29092K->0K(495168K)] [ParOldGen: 5180234K->3606796K(14155776K)] 5209326K->3606796K(14650944K) [PSPermGen: 84517K->84489K(262144K)], 3.2266277 secs] [Times: user=12.55 sys=2.57, real=3.23 secs]
2012-12-24T11:34:29.530+0000: 2744120.646: [Full GC (System) [PSYoungGen: 624K->0K(495168K)] [ParOldGen: 3606796K->3576702K(14155776K)] 3607421K->3576702K(14650944K) [PSPermGen: 84495K->84494K(262144K)], 3.6604210 secs] [Times: user=18.74 sys=0.12, real=3.66 secs]
2012-12-24T11:34:34.224+0000: 2744125.339: [Full GC (System) [PSYoungGen: 320K->0K(495168K)] [ParOldGen: 3576702K->3576667K(14155776K)] 3577022K->3576667K(14650944K) [PSPermGen: 84501K->84498K(262144K)], 4.0962326 secs] [Times: user=18.10 sys=0.11, real=4.10 secs]
Where to configure the heap size and what to consider?
Configure the heap size in the censhare Admin Client at Configuration | Server | Launcher or directly in the file ~/cscs/app/config/launcher.<server>.xml. This requires an application server (JVM) restart.
Check which java applications are currently running and what heap size is configured (-Xmx):
CODEjps -v | grep -i CenShareServerCreate a local working copy of the configuration file:
CODEcp ~/cscs/app/config/launcher.<server>.xml ~/cscs/app/config/launcher.<server>.xml.savedCustomize and store configuration parameters:
CODEvi ~/cscs/app/config/launcher.<server>.xmlChange existing values such as
<Jvmarg value = "- Xms1536m" enabled = "true" />
<Jvmarg value = "- Xmx1536m" enabled = "true" />
to
<Jvmarg value = "- Xms10g" enabled = "true" />
<Jvmarg value = "- Xmx10g" enabled = "true" />Restart the censhare Server:
CODEcenshare.rc restartCheck if the reconfiguration of the JVM heap size was successful:
CODEjps -v | grep -i CenShareServer
Troubleshooting
What if I have increased the heap size but there are still frequent Full GCs and/or OutOfMemory errors?
Ensure that you use the latest java version. Maybe there's a bug in an older Java(TM) SE Runtime Environment version.
Rethink the relation of the RAM allocation for the running (java) processes.
Create a heap dump from the existing situation and check for an OutOfMemory error.
