Learn what metrics mean and how to find them in the Insights web UI.
Metrics Access
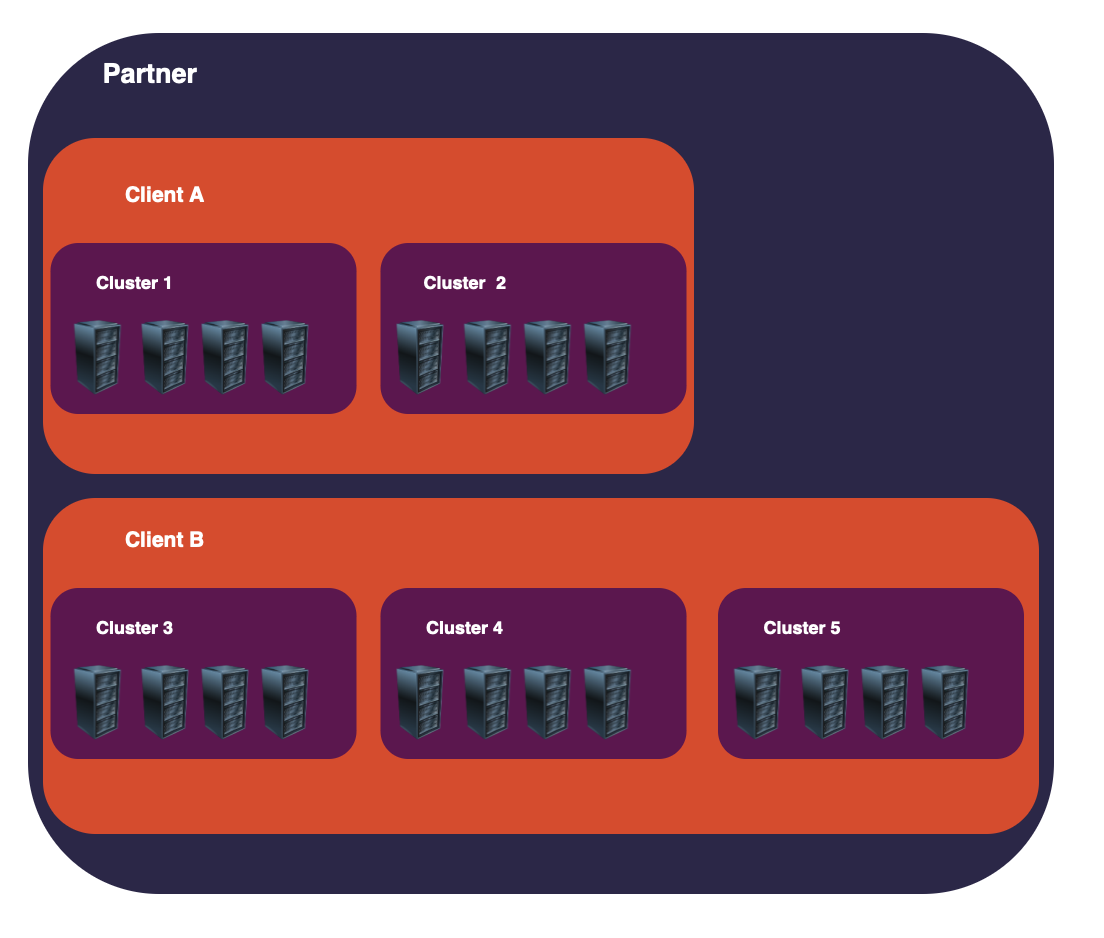
Access to metrics is restricted based on the group membership of the user. Groups represent partners.
The diagram below illustrates this structure:

|
Level |
Definition |
|---|---|
|
Partners |
The top level that represents a partner or company. |
|
Clients |
The level below the partner. It represents one of the clients that a partner manages. Each client has only one partner associated. A partner can have several clients. |
|
Clusters |
The level below the client. It represents a group of Censhare Servers. Each cluster has only one client and a client can have several clusters. |
|
Server |
The lowest level which is a server. |
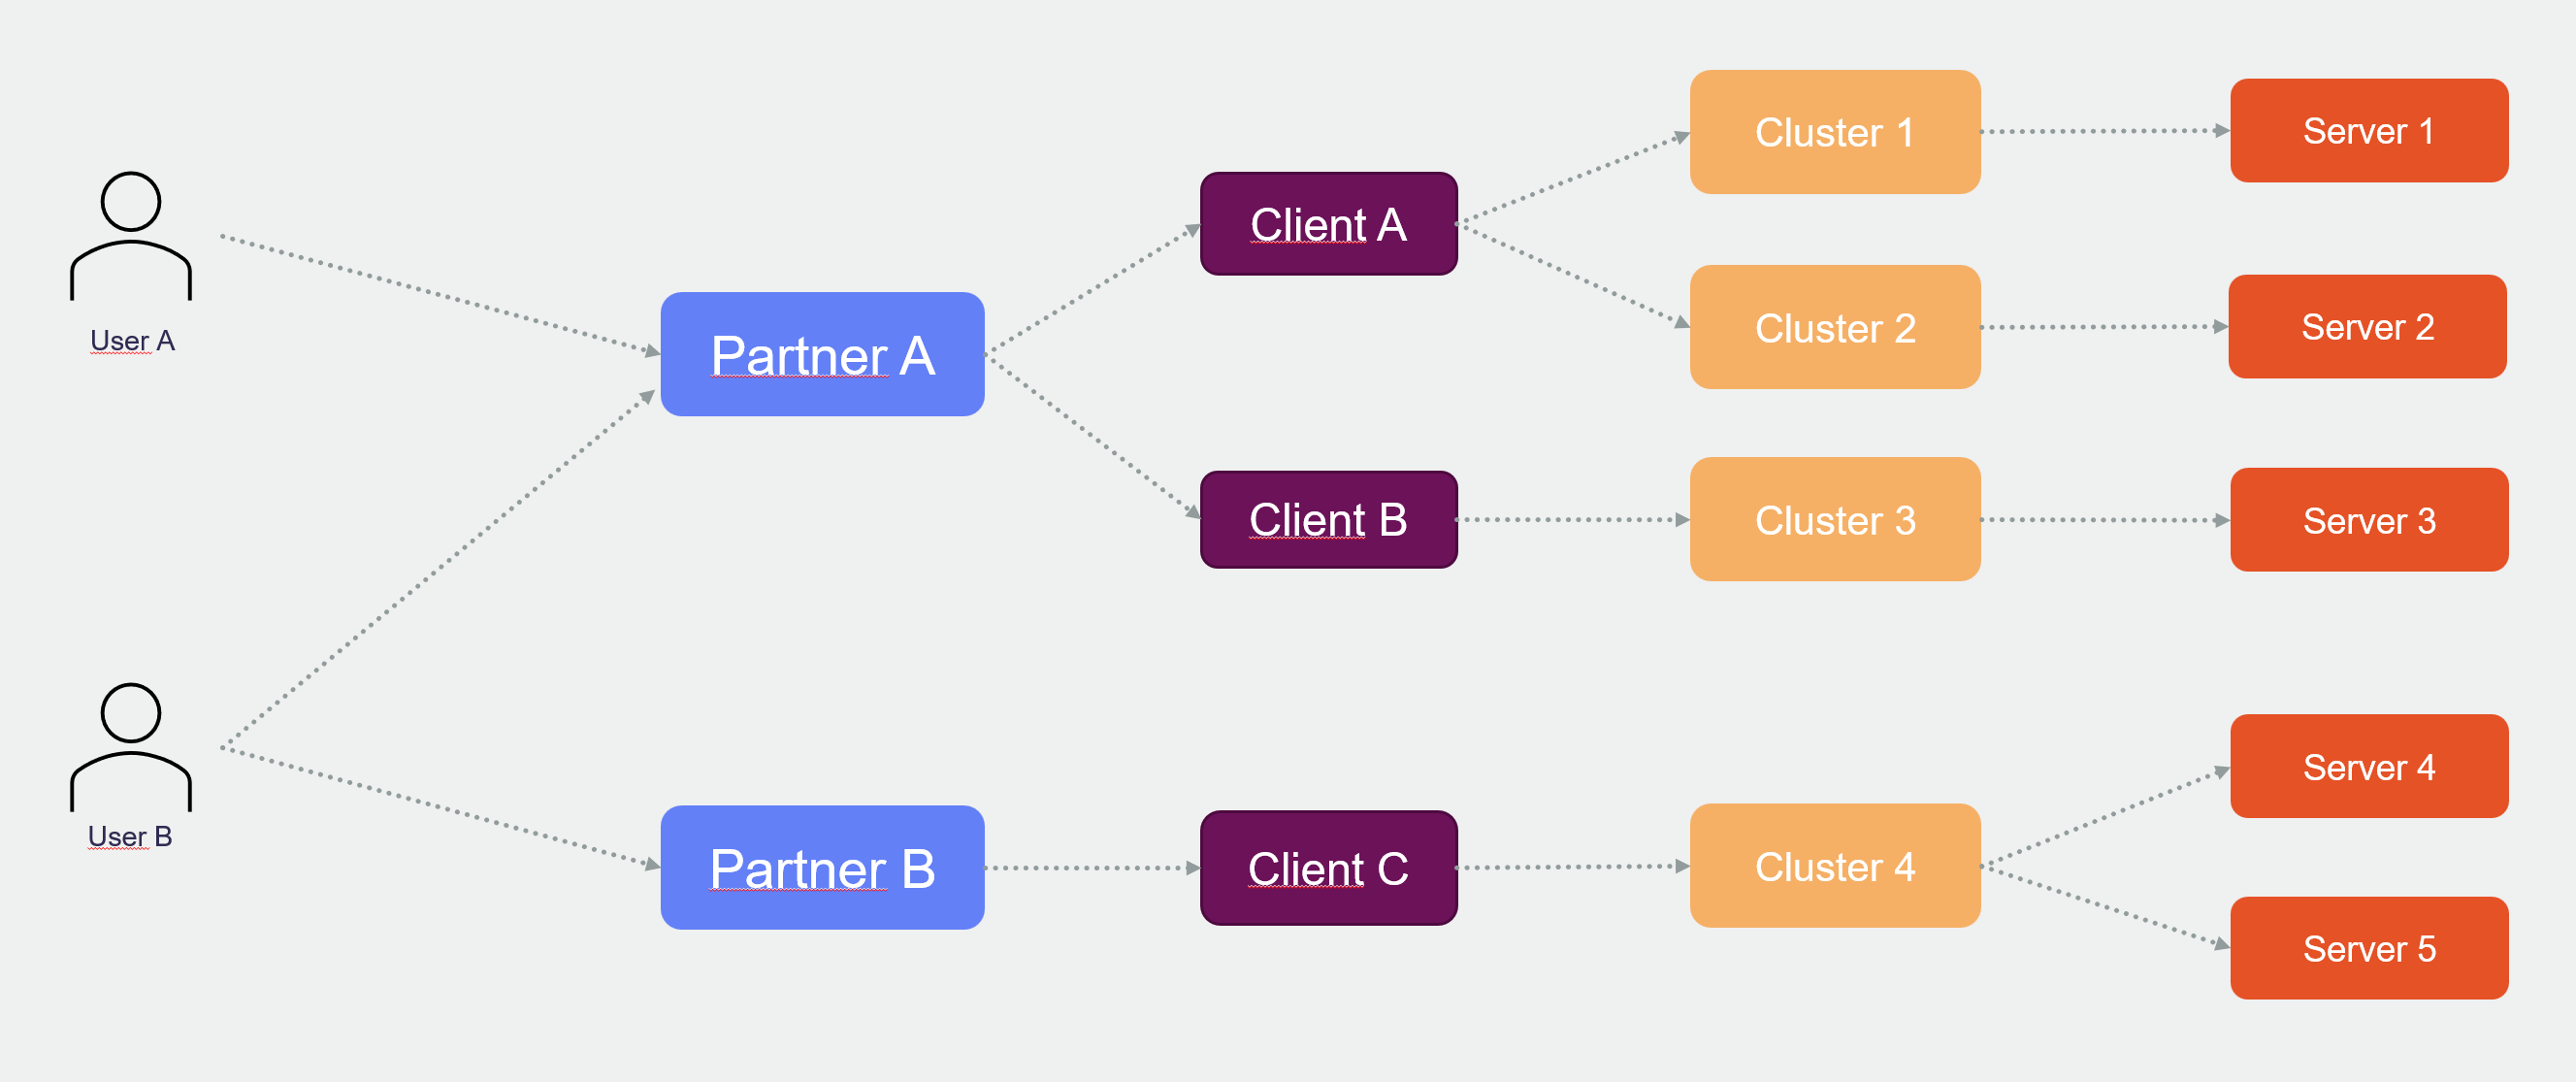
The illustration below shows how this is related to the permission rights.
-
user A is added to Partner A and therefore allowed to access metrics of the servers 1, 2 and 3. These servers are associated with Partner A.
-
user B is added to Partner A and Partner B and therefore allowed to access metrics of the servers 1 to 5.

It is not possible to handpick access on any of the levels below partners.
Which metrics are collected
|
Metric |
Definition |
|---|---|
General
|
|
|
Server |
Name of the Censhare Server |
|
Timestamp |
Shows when the metric has been collected. |
|
Used connections |
Count of clients currently logged-in to the Censhare Server. |
Java Virtual Machine (JVM)
|
|
|
Total Memory |
Total amount of memory available to Java Virtual Machine |
|
Used Memory |
Amount of memory currently used by Java Virtual Machine |
Master data
|
|
|
Workflows |
Count of defined workflows |
|
Application servers |
Count of connected Censhare application servers |
|
Features |
Count of defined and assignable features |
|
Domains |
Count of defined domains |
|
2nd domains |
Count of defined 2nd domains |
|
Roles |
Count of defined roles |
Operating system
|
|
|
Load average |
Measure of the average amount of computational work that a system performs |
|
Available processors |
Count of system's available CPUs |
Database connections
|
|
|
Used connections |
Count of connections to database currently being in use |
|
Total connections |
Count of currently available database connections |
|
Max connections |
Count of maximum configurable database connections |
Layout service
|
|
|
Invocations |
Count of requests being sent to Adobe InDesign Service |
|
Limit |
Maximum number of requests that can be sent to Adobe InDesign Service at the same time |
Image service
|
|
|
Invocations |
Count of requests being sent to Image Service |
|
Limit |
Maximum number of requests that can be sent to Image Service at the same time |
Asset management
|
|
|
Average check out time |
Average duration of asset check-out |
|
Max check out time |
Maximum duration of asset check-out |
|
Average check in time |
Average duration of asset check-in |
|
Max check in time |
Maximum duration of asset check-in |
Embedded database
|
|
|
Average read time |
Average time needed to read an entry in the embedded database |
|
Max read time |
Maximum time needed to read an entry in the embedded database |
|
Average update time |
Average time needed to update an entry in the embedded database |
|
Max update time |
Maximum time needed to update an entry in the embedded database |
|
Write checkpoint time |
Time needed to write checkpoint to embedded database |
|
Average query time |
Average time needed to query the embedded database |
|
Max query time |
Maximum time needed to query the embedded database |
SQL database
|
|
|
Average generate sequence time |
Average time needed to create a sequence in the SQL database
|
|
Max generate sequence time |
Maximum time needed to create a sequence in the SQL database |
|
Average insert/update/delete time |
Average time needed for the execution of INSERT, UPDATE and DELETE statements in the SQL database |
|
Max insert/update/delete time |
Maximum time needed for the execution of INSERT, UPDATE and DELETE statements in the SQL database |
|
Average query time |
Average time needed to execute a query in the SQL database
|
|
Max query time |
Maximum time needed to execute a query in the SQL database |
Users
|
|
|
Total amount |
Total count of registered users |
|
Users without password |
Count of registered users who do not have a password set |
|
Logged-in users |
Count of users currently logged-in to the system |
|
Users logged-in all time |
Count of users that have logged into the system at least once since the logging tool has been deployed |
|
Logged-in clients - java client |
Total count of all java clients (Censhare Client) currently logged-in to the system |
|
Logged-in clients - web client |
Total count of all java clients (Censhare Web) currently logged-in to the system |
|
Logged-in clients - admin client |
Total count of all java clients (Censhare Admin Client) currently logged-in to the system |
|
Logged-in clients - service client |
Total count of all java clients (Censhare Service Client) currently logged-in to the system |
|
Logged-in clients - renderer client |
Total count of all java clients (Censhare Render Client) currently logged-in to the system |
|
Total logged-in clients |
Total count of all currently logged-in Censhare clients. Each user can be logged-in with multiple clients. This metric is the sum of the five previous ones. (And not a count of unique users). |
Viewing Metrics: Dashboard
In a few easy steps you can handpick server metrics that you need.
Please make sure that you have been assigned necessary rights before proceeding. Otherwise, you won't be able to see any metrics.


Retrieve metrics
-
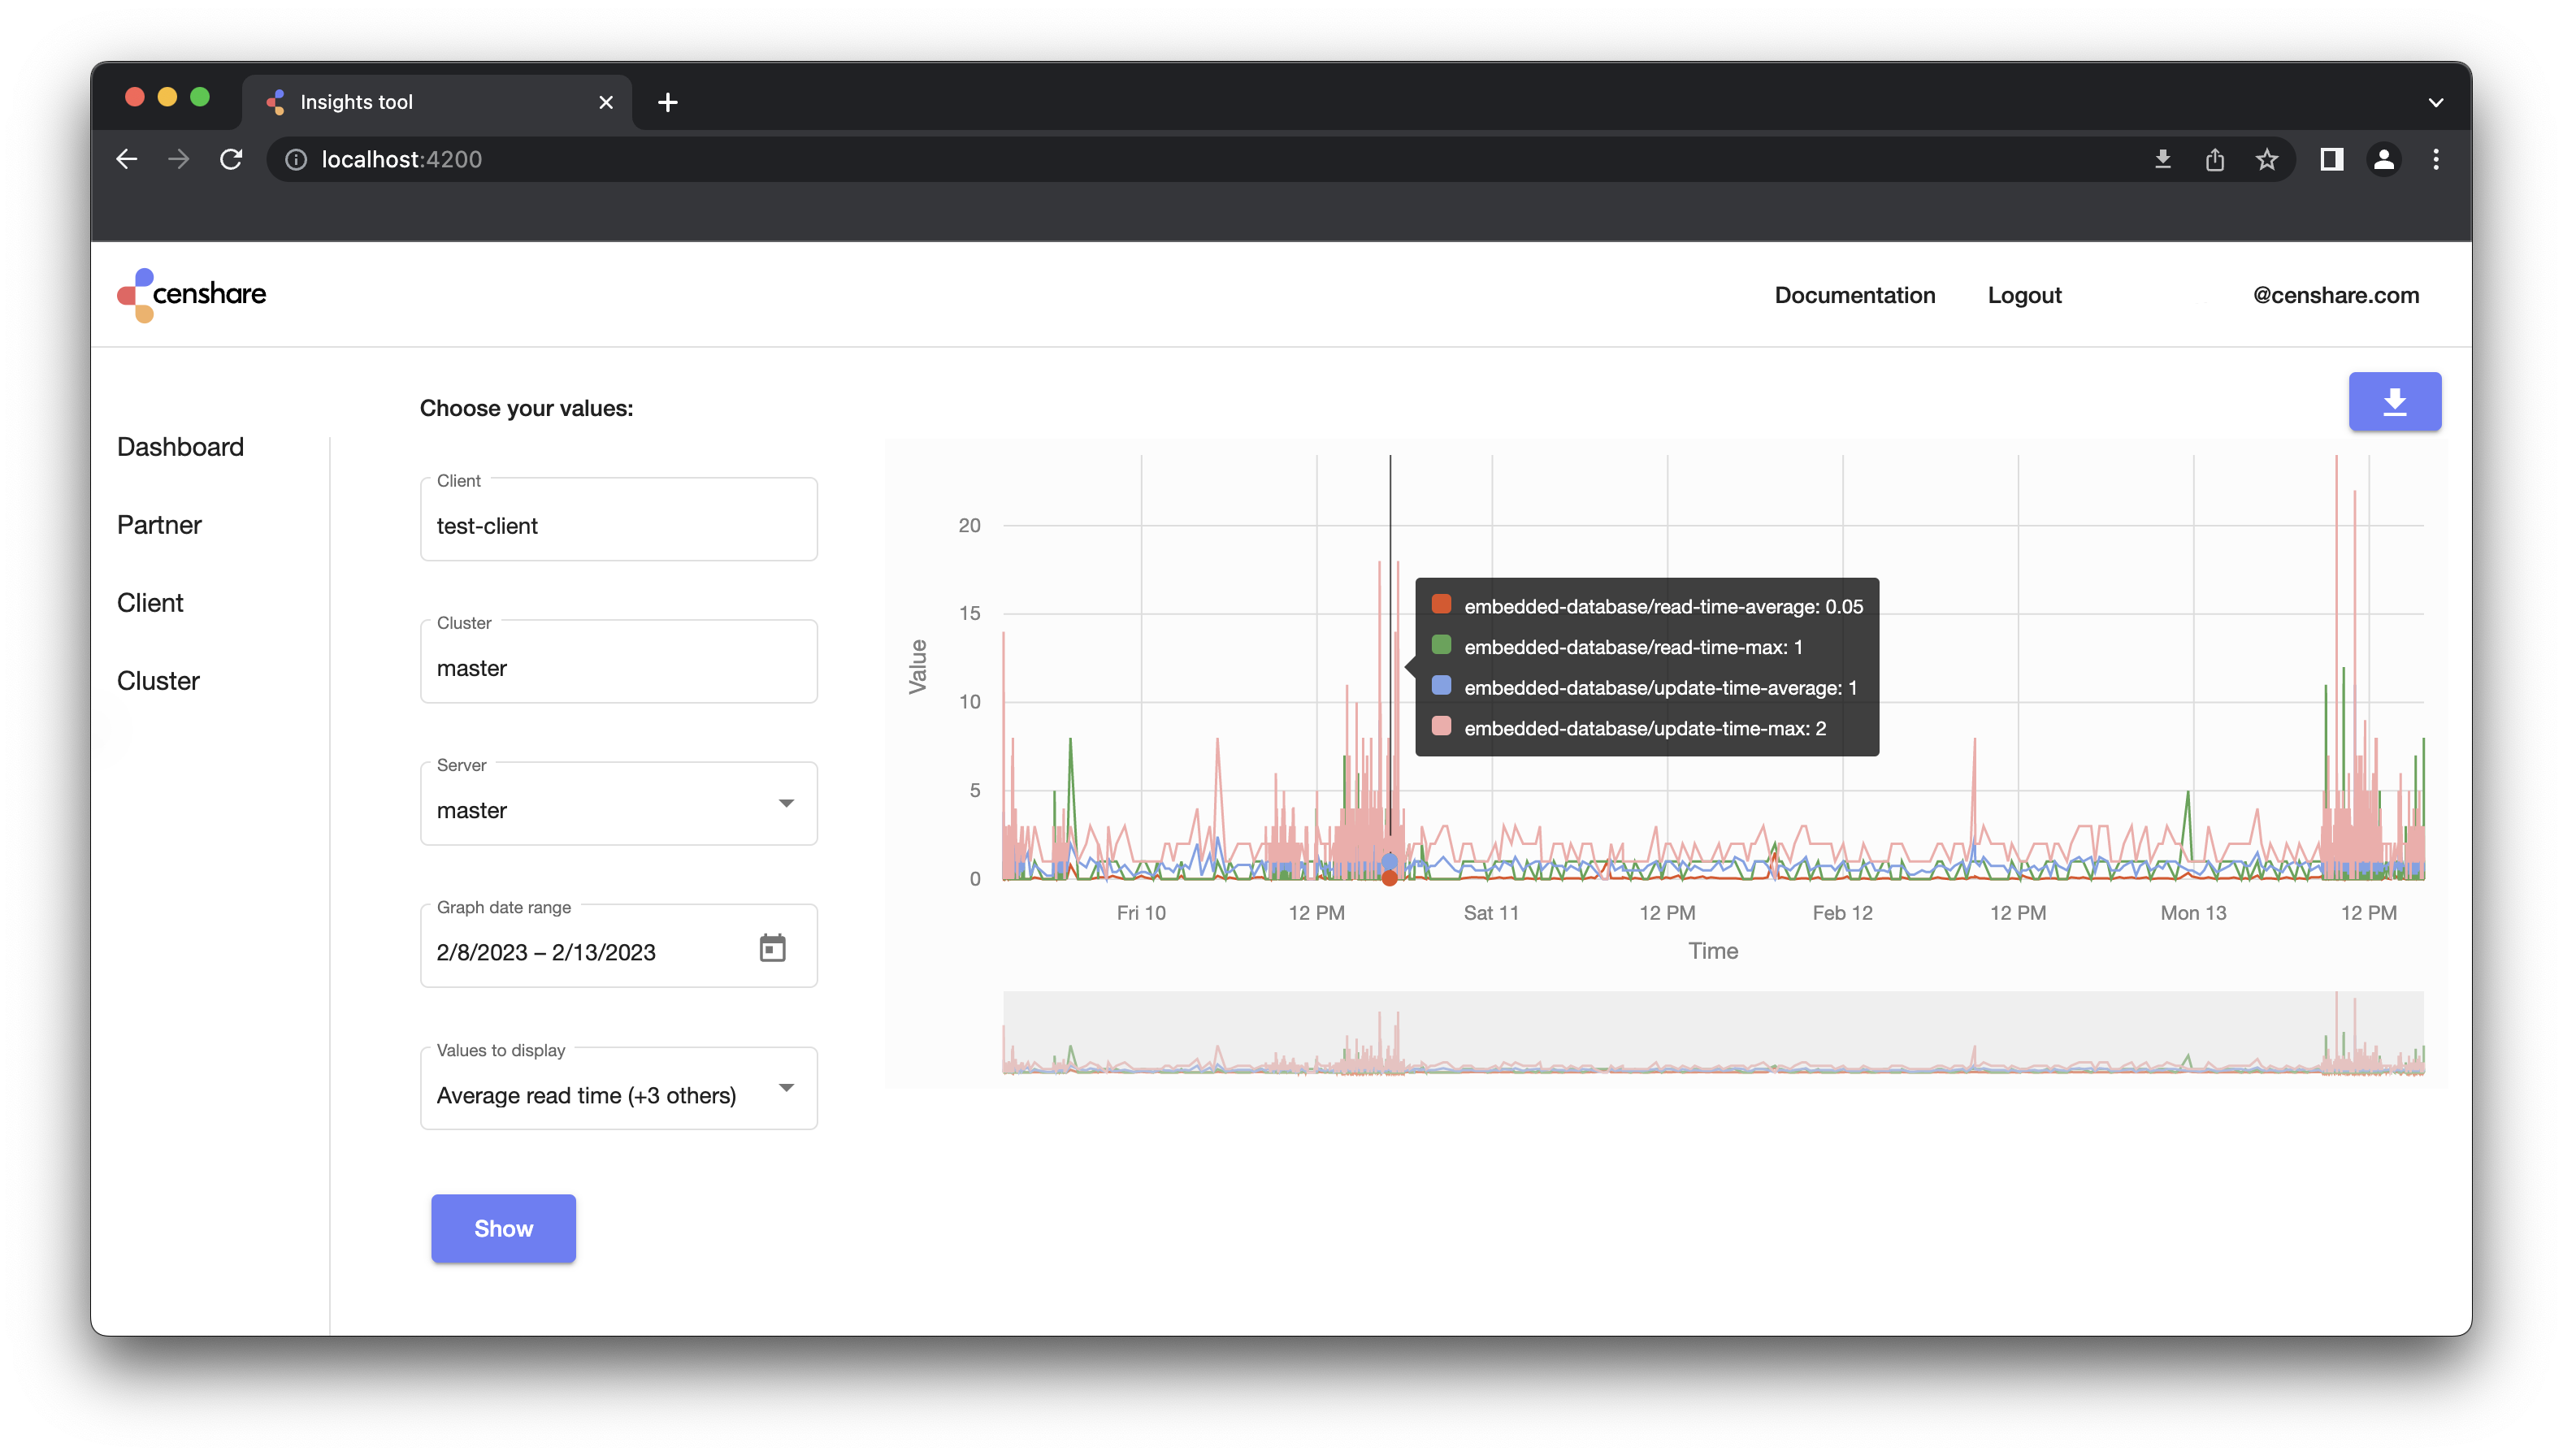
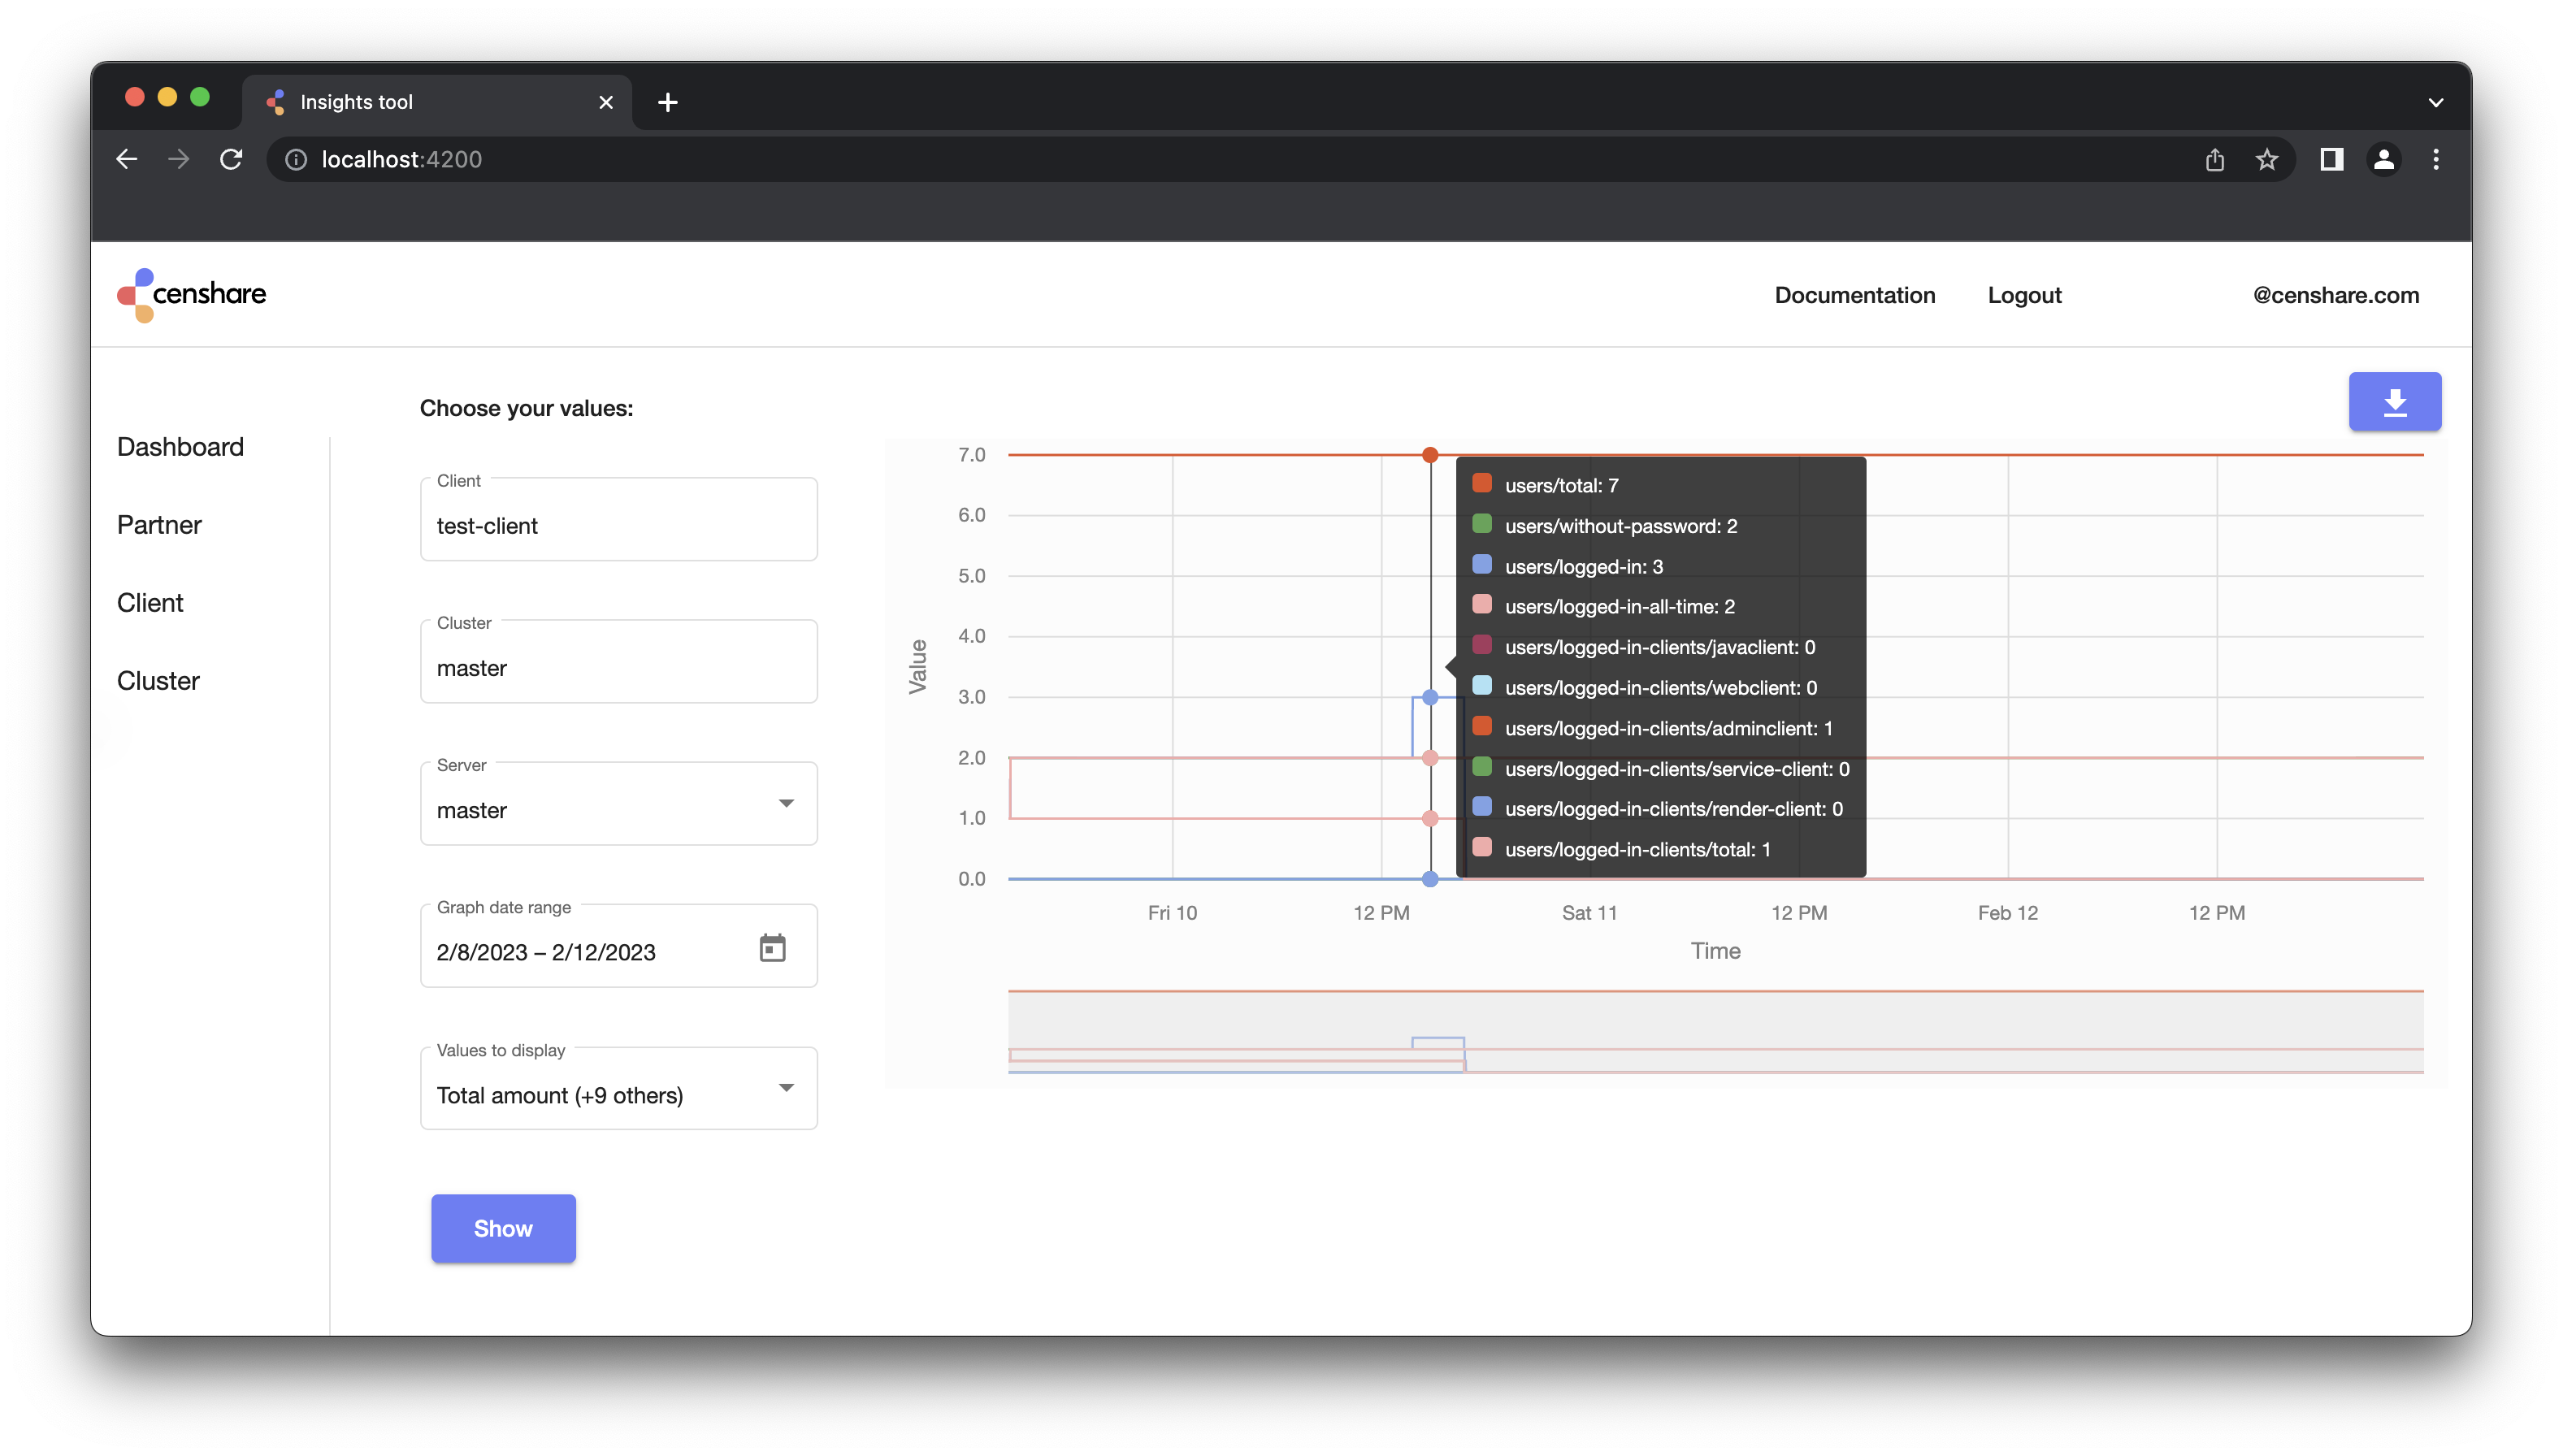
To view metrics of a server, you must first select its partner, client, and cluster (exactly in this order, from top to bottom in the filter section). The cluster list contains only clusters of the partner you have access to.
-
Once you selected the cluster, the server list is updated with the servers of the selected cluster.
-
Continue by selecting the time range. If you want to see a specific day, use the same start and end date.
-
Select the metrics you want to see.
-
To retrieve and see the metrics click on the "Show" button.
-
A chart will be populated with the metrics you have chosen.
-
Hover over the chart if you want to display values for a specific hour.
Access metrics documentation
If you want to check the exact meaning of any metric, you can quickly access the metrics cheat sheet. Click on the Documentation link in the top right corner of the Insights web application.
Export metrics
-
Click the blue arrow icon on the top right of the chart.
-
When you click the button, it generates and downloads the Excel files.
-
Check your download folder to find the files.
-
Each metric is exported to a separate Excel file.